
From-To Chart to Measure Flow Efficiency
From-To Chart
When it comes to improving a system, it doesn't always require new technology or massive investment. Sometimes, the biggest inefficiencies are hidden in how things move, including materials, documents, people, or information. That's why the from-to chart (FTC) is used.
What is a From-To Chart?
A from-to chart is a quantitative tool used to analyze movement or flow between departments, workstations, or process units within a system.
It records:
- Where something comes from
- Where it goes to
- How often the movement happens
- How costly or inefficient the movement is
Even now, FTC is widely used in facility layout planning, process improvement, lean operations, logistics, and supply chain analysis. In these fields, FTC is used to identify inefficient layouts, reduce unnecessary movement, support data-driven redesign decisions, and quantify flow efficiency instead of relying on intuition.
Strengths or Benefits of From-To Chart
1. Highly Visual and Quantitative
FTC transforms complex movements into a clear matrix. FTC changes complex raw data into counts of movement and efficiency calculation of the action. This helps analysis of current flow and layout, making it easy to spot inefficiencies.
2. Supports Layout Optimization
The chart helps determine which departments should be placed closer together or further apart by comparing flow intensity and efficiency results.
3. Scalable
This tool can be applied to any type of systems, including small offices, factories, warehouses, service systems, etc.
Weaknesses & Limitations of From-To Chart
1. Assumes Stable Processes
FTC works best when processes are repetitive and stable. Meanwhile, highly dynamic systems may distort results.
2. Data Collection can be Time-Consuming
Accurate FTC requires reliable data on movement frequency and distances. To collect these data, observation has to be done for a long period of time to make sure that the required information is true and unbiased for certain time frames.
3. Does Not Capture Qualitative Factors
This chart does not take qualitative factors, such as human fatigue, safety risks, or communication quality, into account. Hence, other additional qualitative observations and analyses have to be conducted alongside the from-to chart.
Step-by-Step: How to Create a From-To Chart
Step 1: Identify Departments or Process Units
Identify and list all departments, workstations, or process steps involved.
For example:
- A: Receiving
- B: Production
- C: Packaging
- D: Storage
Step 2: Observe and Record Movements
Track how often materials, documents, or people move from one department to another for a period of time.
For example:
- Receiving to Production = 30 times/day
- Packaging to Storage = 20 times/day
Step 3: Construct the From-To Count Matrix
Create a table where:
- Rows = From
- Columns = To
- Cells = Number of movements
| From\To | A | B | C | D |
| A | - | 30 | 0 | 0 |
| B | 0 | - | 25 | 5 |
| C | 0 | 5 | - | 20 |
| D | 0 | 0 | 0 | - |
Table 1: Example of From-To Chart for Movement Calculation
Table 1 gives an example of the record of movement between the 4 departments, A, B, C, and D. The information given from the chart is as such:
- There are 30 recorded movements of objects from Dept. A to Dept. B.
- 25 objects from Dept. B move to Dept. C.
- Meanwhile, 5 objects from Dept. B move to Dept. D.
- From Dept. C, 20 objects continue to Dept. D.
- However, 5 objects from Dept. C backtracked or moved back to Dept. B.
These results will then be compared with the correct flow of objects. Is the backtracking meant to happen? Or was it due to some problems? Is the movement or flow efficient already? How many objects actually move according to the correct flow?
Advanced FTC: Calculate Efficiency
Step 4: Assign a Weight Ratio
The weight ratio is something used to compare the priority of each task or object. It can be the weight of a product, production cost, the distance between departments, the time needed for production, etc.
For example:

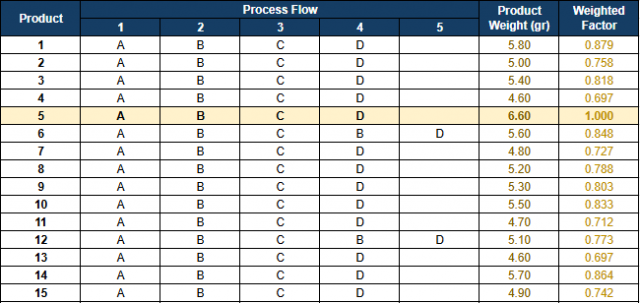
Step 5: Calculating the Weighted Factor
After each component has been recorded with its weight ratio, the weighted factor can be calculated using the formula below.
![]()
Hence, for the given example, the weighted factor of each product will be as shown in Figure 2.
Step 6: Creating the FTC Matrix with Efficiency Result
Figure 3 shows the complete calculation of efficiency based on the given sample data.
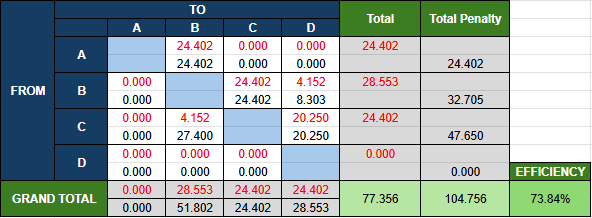
The red numbers in the from-to matrix are calculated by summing up the weighted factors of products that move from and to the calculated department. For example, from A to B, check the recorded movement or flow. Then, for all products that move from A to B, the weighted factor of that product will be added together.
The black numbers in the from-to matrix, above the blue horizontal blocks, are calculated by multiplying the red number above it with the step(s) away from the horizontal. For example, for cell "From A to B," it is one block away from the blue block, so it will be (24.402 x 1). Next, for cell "From A to C," it is two blocks away from the blue block, so it will be (0.000 x 2).
Meanwhile, for the black numbers in the from-to matrix, below the blue horizontal blocks, in addition to the multiplication like what's done for those above the horizontal blocks, it will also be multiplied with the highest weight ratio. For example, in the sample data, the highest weight ratio is 6.60 grams. So, for cell "From C to B," it will be (4.152 x 1 x 6.6).
The efficiency is then calculated by dividing the sum of total with the total penalty.

Comments :