
Investment Evaluation Tools
Important Investment Evaluation Tools to be Considered
When proposing a new system, launching a product, or optimizing a process, one big question always comes up: "Is this investment really worth it?" That’s where investment evaluation tools come in. These tools help translate ideas and project proposals into quantitative decisions—balancing engineering logic with financial sustainability. Some of the most common investment tools are discussed below.
Net Present Value (NPV): The Value of Future Cash
NPV measures how much a series of future cash flows is worth in today's money. It accounts for the time value of money. NPV is essential for long-term projects like factory expansions, automation, or software systems, where future cash flows vary over time. It provides a clear "go" or "no-go" based on financial impact.
Formula:
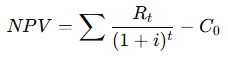
- Rt = net cash inflow in year t
- i = discount rate (cost of capital)
- C0 = initial investment
Interpretation:
- NPV > 0 → profitable investment
- NPV < 0 → unprofitable
- NPV = 0 → break-even
Payback Period (PP): How Fast the Investment Pays Itself
The payback period tells how long it takes to recover the original investment from cumulative cash inflows. However, it doesn't account for the time value of money or cash flows after the payback point. That's why discounted payback period (DPP) may be more preferred, as it factors in discounting.
Formula:

Interpretation:
- A shorter payback period means a faster return with lower risk.
- A longer payback period means higher uncertainty.
Internal Rate of Return (IRR): The Project's True Yield
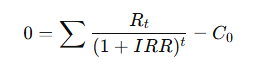
The internal rate of return (IRR) is the discount rate that makes NPV equal to zero. It shows the project's expected rate of return. IRR is intuitive and easy to compare between projects, especially when capital is limited. However, for projects with irregular cash flows, IRR can be misleading since multiple IRRs can exist.
Formula:
Interpretation:
- If IRR > required rate of return → accept
- If IRR < required rate of return → reject
Return on Investment (ROI): The Classic Profitability Metric
Return on investment (ROI) measures how much profit you gain relative to your investment. ROI is quick, simple, and suitable for comparing multiple small-scale initiatives, such as marketing campaigns, prototype development, or training investments.
Formula:
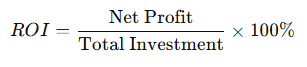
Interpretation:
Higher ROI = better return on every currency value invested
Profitability Index (PI): Value per Currency Value Invested
Profitability index (PI) shows how much value is created per unit of investment. PI helps when ranking multiple projects under a limited budget, showing which investment yields the best results.
Formula:
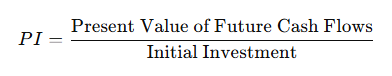
Interpretation:
- PI > 1 → profitable
- PI < 1 → not worth pursuing
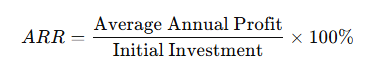
Accounting Rate of Return (ARR): Profitability Based on Accounting Data
ARR calculates return based on average accounting profit, not cash flow. It's simple but risky because it uses profits instead of cash. This makes it easier to compute but less accurate, especially when non-cash items like depreciation distort the results.
Formula:
These Tools in Practice
These tools can be used to make well-rounded decisions. For example, payback period for liquidity and risk concerns. NPV and IRR for long-term project evaluation. ROI and PI can be used for comparing short-term or multiple alternatives. Meanwhile, ARR for quick accounting perspectives.
By analyzing from multiple angles, they ensure both financial feasibility and strategic alignment with company goals.

Comments :